Differential Analysis Results for Gene Expression using CyberT.
Please visit the above link for more detailed information.
Differential analysis statistics including p-value are provided in the following table.
Control Replicates are appended with a "C_"
PyMT Replicates are appended with a "E_"
"Data Visualization" allows for examination of charts for various statistics, as well as filtering options to export a subset of the table.
CMap results are collected from CMap for up and down regulated lists at three pvalues (0.05, 0.01, 0.001). Please use the dropdown menu to select a p-value.
3 Files are available for download from the queried results:
- By CMAP NAME
- By ATC NAME
- By CELL LINE AND NAME
Data visualization is provided for the CMap main results.
Differential Analysis Results for Gene Expression using CyberT.
Please visit the above link for more detailed information.


Differential analysis statistics including p-value are provided in the following table.
Normal Calorie Replicates are appended with a "C_"
High Calorie Replicates are appended with a "E_"
"Data Visualization" allows for examination of charts for various statistics, as well as filtering options to export a subset of the table.
CMap results are collected from CMap for up and down regulated lists at three pvalues (0.05, 0.01, 0.001). Please use the dropdown menu to select a p-value (p-value 0.05 unavailable due to CMAP unable to process over 1000 unique symbols).
3 Files are available for download from the queried results:
- By CMAP NAME
- By ATC NAME
- By CELL LINE AND NAME
Data visualization is provided for the CMap main results.
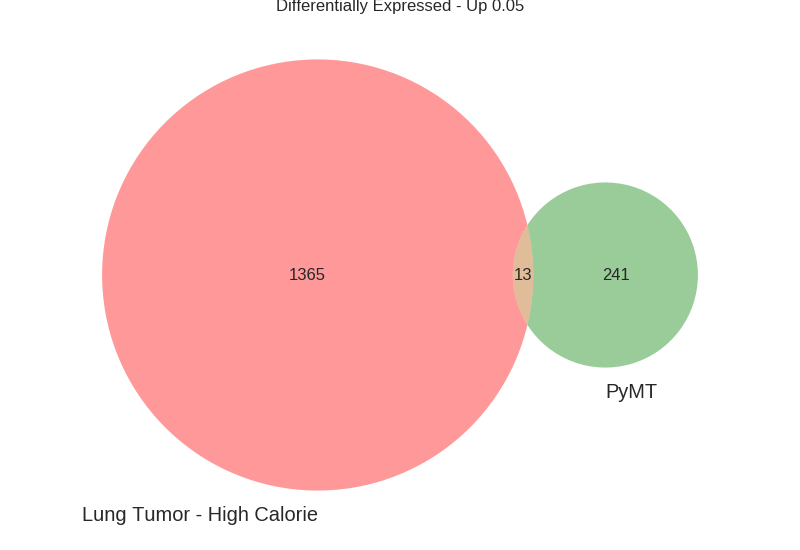
Top results for Drugs common to differential expression changes in both PyMT and Lung Tumor that induce those differential changes (Positive Connectivity Score). Please use columns to sort on Rank or Score for each experiment.
Columns
- Drug (Name Provided by CMAP)
- PyMT-Rank (Rank of Drug in PyMT Differential Expression)
- PyMT-Score (Connectivity Score in PyMT Differential Expression)
- PyMT-Dose (Perturbagen Dose in PyMT Differential Expression)
- LTHC-Rank (Rank of Drug in Lung Tumor High Calorie Differential Expression)
- LTHC-Score (Connectivity Score in Lung Tumor High Calorie Differential Expression)
- LTHC-Dose (Perturbagen Dose in Lung Tumor High Calorie Differential Expression)